Residence Time Distribution Curve analysis and interpretation – A powerful tool to monitor the “health” of glass melt and the furnace, and to prevent unwanted effects on the quality of the final glassware product.
Independently of the type of glass we are going to produce, or which kind of furnace we are going to install, the final quality of our glassware product might be rejected due to dimensional instability or cosmetical defects, which are both linked to the quality of the glass melt in terms of physical and chemical homogeneity, thermal stability, aging of contact glass refractories and turnover time of the melt inside the refractory tank (furnace).
Temperature profile is brought under control by continuous monitoring with strategically placed thermocouples at precise spots along the furnace and distributors. Also the pull rate is continuously monitored, directly and indirectly by the production ratio, but concerning turnover inside the furnace, homogeneity of the melt and how it is distributed from the loader to the throat, and if some stagnant zones or short circuits have been created not any additional info are available or linked to continuous check.
Even combining temperature profile and pull rate parameters together with chemical analysis of the glass, would not be enough to ensure the quality of our glassware product in the majority of the situations.
A powerful tool, called the “Residence Time Distribution Curve” can be used to evaluate the behavior of the glass melt in the furnace (related to furnace type, shape, aging, profile).
As the name states, a Residence Time Distribution Curve (RTDC) is a curve which traces a concentration of a certain element (tracing agent) in a series of glass samples collected throughout the process (generally cold end samples).
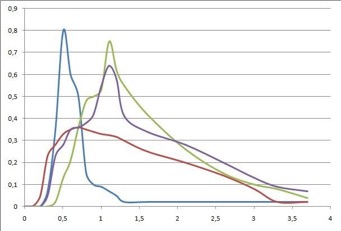
on the left RTDC piston flow (blue) and mixed (black). On the right Transition Function
First of all, it is important to create an RTDC using a suitable tracing agent (Ta) to add to the molten glass. As a Ta, it is preferable to use a chemical element that does not compromise the batch pack, and in a correct quantity to be detectable while not affecting glass properties, avoiding:
- modification in flux inside the furnaces,
- problems in forming zone,
- variation of typical characteristics of the final product (transition metals are to be avoided due to colouring properties, even in low concentrations; in addition, Iron is usually already present around 100 – 150 ppm as baseline, coming from stainless steel and raw materials contamination).
Another plus would be if the relative raw materials available were as simple as possible (oxides being the best choice).
Depending on detection methods, it is possible to use alkali or earth or metallic oxides such as Sr2O, ZnO, MgO (when not used as a modifier or where Dolomite is not a batch component) or SnO2; all of them are relatively cheap, easily melted, do not change glass colour, are easily detectable by chemical analysis and do not contribute to variations in glass properties in the quantities needed.
ZrO2 is not a good choice because it is hard to melt and could give inclusions revealed as defects in the cold end and then be rejected; and secondarily because it is the main component of contact glass refractories, so it would not be effective as a Ta. A good choice is CeO2 as it shows an intense fluorescence activity in glass placed under a special lamp, which helps to quickly obtain an RTDC. Regarding best practices for obtaining a valuable RTDC, first consider the detection limits of available analytical techniques and then the total quantity of the molten glass bath; a generally acceptable starting point is 10 kg of oxide / 100 tons of melt that correspond to 100 ppm (part per million) if the total melt is immediately conditioned by the total Ta.
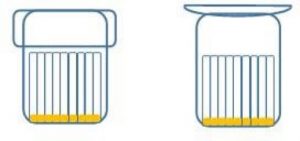
Ta has to be introduced directly in the loader while it is as empty as possible just to prevent unwanted dilution and/or delay. After the introduction of a Ta into the loader, it is then necessary to start collecting samples from the cold end following a scheduled plan, labeling each sample with the date, time and line. Frequency of sampling is not fixed but instead is decided based on experience (low frequency until the first showing, high frequency until the peak, then low frequency is once again possible); the same applies to the total time of RTDC, even if it is always a good choice to do at least 3 turnover times (depending on total molten glass and pull rate). Each of those factors could affect the resolution of the RTDC and of course, the depth of possible analysis and the reliability of results. Clearly, the pull rate should remain as stable as possible for the entire duration of the RTDC test.
One last piece of advice is related to the cullet: for the entire duration of the RTDC test, it is imperative to not reuse the cold end cullet. This will prevent cross contamination and confusing results. In theory it is also possible to use a combination of Ta, (two is more common) especially when there is more than one loader, to trace different loading zones flux and effects.
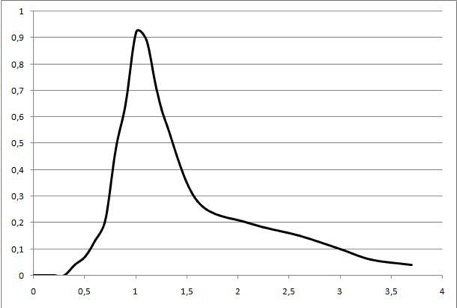
Once we have obtained RTDC it is necessary to analyze and “translate” the results to uncover all available data. A typical RTDC has the following shape:
some exemples of realistic RTDC
The shape of a curve immediately gives information about the molten glass mixing grade: piston flow shaped curve (blue curve in Fig. 2) is typical for an unmixed process (quantic flow) where the packet of batch and the glass flows along the tank without mixing. The shape associated with a well-mixed process is instead a broadly shaped curve (red curve in Fig. 2), in this case the relative concentration of Ta is lower and also the peak is less pronounced, this is due to the mixing process (convective backflow, etc.) that promotes the conditioning of the entire molten bath.
The two main parameters to best interpret the RTDC are:
- the timing of the first appearance of Ta, referred to as First Show or Minimum RT
- the timing of the appearance of the maximum concentration of Ta, referred to as Peak or Maximum RT
The relative position of these two data points, compared throughout the process, could give the initial qualitative information regarding furnace mixing process and flows. Going deeper into the analysis, it is important to consider other factors such as:
- Normalized time. To have a repeatable and comparable RTDC, time has to be normalized taking into consideration the geometrical resident time or turnover time (τ) obtained by considering the total amount of molten glass in the tank and the pull rate. For example, (100 tons of melt) divided by (2 tons/h of pull rate) is equal to τ = 50 h. By converting time into % of τ, it is possible to discover much more information from our RTDC; like, for example, a preferential track in the tank, some stagnant zones, more flows (more spikes) and also if the real process is a combination of flows (piston + mixed) and if so, to what ratio.
- FWHM (Full Wide at Half Maximum). The final suggested parameter is not a common one, but it is based on my experience and I have verified how it might be very useful. The above mentioned FWHM is a typical parameter used in spectroscopy or Physics and Chemistry to evaluate a peak or a “spike” in optical or electronic analysis, and gives information on the shape of the spike and consequently on the “resolution” of the signal. This number is obtained by marking two points at approximately half the height of the curve (spike) and measuring the time delta between them. The benefits of applying this concept to RTDC include an excellent evaluation of what happens before the Peak (with First Show mainly) and also after the appearance of the maximum concentration of Ta. This parameter can give a Technologist all relevant information regarding why the eventual spike is thin and resolute (piston flow ideal) or if the peak is broad and the magnitude of this effect. It is also possible to better understand preferential tracks associated with stagnant zones, mixing grade, delay, or some unwanted cross contamination.
In effect, the process to obtain RTDC is a sort of Chromatography, where stationary phase and mobile phase are both in the form of molten glass. Ta is the component that is carried by the mobile phase into the stationary one. The interactions and mixture between Ta and glass determines the shape of RTDC. In much the same way that chemical affinity between component and stationary phase in Chromatography defines the detection time and peak (spike) shape: in RTDC affinity is replaced with mixing grade and is strictly correlated to melting process, technical parameters and furnace situation (design and aging).
Oliver Bellina / 19 July 2017 /